9 The climate of equality, diveristy and inclusion

The following chapter provides an overview of the main questions regarding workplace culture and climate, including perceived discrimination.
Masculinity Contest Culture, Chilly climate, Perceived discrimination
In addition to work-life balance issues covered in Chapter 8 the GEAM questionnaire contains two dedicated sections on organisational culture and climate regarding inclusive gender equality. A “chilly” organisational climate has been consistently identified as a main factor driving women out of science Arredondo et al. (2022a) due to the subtle yet pervasive forms of gender bias that create unwelcoming environments for women in academia. First introduced by Hall and Sandler in (1982), the term captures how everyday interactions, institutional norms, and structural inequalities can collectively undermine women’s confidence, sense of belonging, and career progression.
STEM fields are particularly affected by chilly climates, where women frequently report feelings of isolation, lack of recognition, and heightened scrutiny. The book Women and the Challenge of STEM Professions (Arredondo et al. 2022b) provides recent and compelling narratives from women in science, illustrating how these climates not only hinder professional advancement but also impact mental health and job satisfaction.
Over the decades, the “chilly climate” concept has evolved from a focus on overt discrimination to include more nuanced understandings of microaggressions, implicit bias, and systemic exclusion. As summarised by Müller, Striebing, and Schraudner (2022), although overt discrimination has thus declined, subtle forms remain pervasive and equally harmful. Differences in perceived discrimination are taken as a proxy for actual discrimination, with research showing that perceived discrimination significantly impact individuals’ mental and physical health, job satisfaction, and organizational commitment (Colella et al. 2012; Triana et al. 2019). The resulting decline in employee well-being and performance can undermine overall organizational effectiveness. Because these forms of discrimination are harder to detect, they require a solid measurement approach as delineated in what follows.
Organisational culture and climate is covered in two broad question groups in the GEAM, that cover the following issues:
Perceptions of gender equality inquires about any differences in organizational commitment to gender equality or differences in the equal treatment and participation of women and men (
OCPER001)Preferential treatment is a further crucial question block.
OCPER003asks about the perception regarding differential allocation of resources (e.g. funds) and recognition of intellectual contributions (e.g. during meetings or through awards).Opportunities for career progression
OCWC002assembles an additional 9 items on opportunities usually associated with career progression such as access to seniors staff, decision-making positions, mentorship, encouragement, among others.Promotion Opportunities and obstacles to career promotion are covered in
BACD005.Masculinity Contest Culture measures how strongly an organization or organizational unit endorses masculine norms, thus producing a “chilly climate” for women and men (
GlickMasculCont8).Bias against women leaders Although conceptualised as a specific measurement scale for women in leadership positions,
DiehlBiasLeaderAgreeandDiehlBiasLeaderFreqcapture several dimensions of gender bias. In combination with questionWCJC027“How many people do directly and indirectly report to you” andSDEM004on gender identity, specific bias against women leaders can be analysed.
In what follows we briefly introduce some of these measurement items and their relevant scientific literature. As it will become apparent, some questions and sub-question items do overlap to a certain extend.
9.1 Perceptions of gender equality
One of the consistent findings of the ASSET Survey 2016 has been that men reported a more positive perception of equality, diversity and inclustion aspects than women. The GEAM captures the perception of gender equality issues through several items. OCPER001 inquires about any differences in organizational committment to gender equality or differences in the equal treatment and participation of women and men. OCPER003 on the other hand examines differences in the allocation of several type of resources and responsibilities.
| Code | Question & question-items |
|---|---|
OCPER001 |
Please indicate the extent to which you agree or disagree with the following statements: |
.SQ001. |
In general, men and women are equally represented (in terms of numbers) in my organisation |
.SQ002. |
In general, men and women are treated equally in my organisation |
.SQ003. |
My organisation is committed to promoting gender equality |
.SQ004. |
Myself and colleagues know who to go to if we have concerns related to gender equality |
.SQ005. |
My organisation is responsive to concerns about gender equality |
| Response options | |
| [1] Strongly disagree [2] Disagree [3] Neither agree nor disagree [4] Agree [5] Strongly agree |
Using familiar code to plot likert scales, we can generate an overview of the response patter across all sub-question items as show in Figure 9.1
Show code for figure
cpal <- RColorBrewer::brewer.pal(4, "RdYlBu")

df.geam01 |>
  select(starts_with("OCPER001.SQ")) |>
  plot_likert(values="hide",
              show.prc.sign = T,
              grid.range = c(1,.3),
              expand.grid = T,
              show.n = T,
              wrap.legend.labels = 15,
              wrap.labels = 30,
              catcount = 4,
              reverse.scale = T,
              cat.neutral = 3,
              geom.colors = cpal)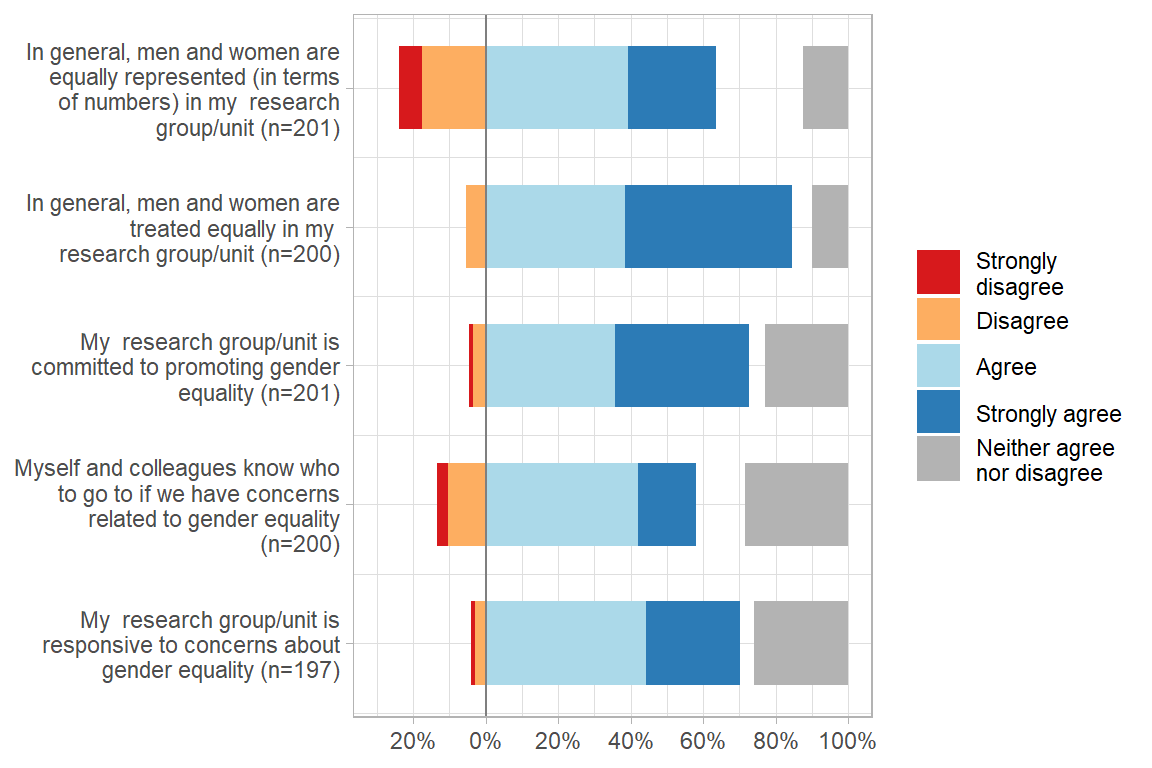
While the general perception is that women and men are treated equally within the organisation (item SQ002) and that gender equality issues are taken seriously within research groups and units (item SQ002 and SQ005), two items receveid a relatively stronger disagreement rating. This concerns the equal representation of women and men in research units (SQ001) as well as the general knowledge of whom to approach with GE concerns (SQ004).
Based upon this visual inspection, a follow-up analysis could explore to which degree the perception of unequal representation is specific to women versus men respondents as alluded to in the introduction. Code in lst-ocper001-prepare converts the gender variable SDEM004 into a binary variable (if not already done), and converst the factor of the agreement score to a number.
df.ocper001 <- df.geam02 |>
  mutate(SDEM004.bin = case_when(
    SDEM004 == "Prefer not to say" ~ NA,
    SDEM004 == "Non-binary" ~ NA,
    SDEM004 == "Other" ~ NA,
    .default = SDEM004),
    Gender = fct_drop(SDEM004.bin), #drop unused levels
    AgreementScore = as.numeric(OCPER001.SQ001.)) |>
  filter(!is.na(Gender) & !is.na(AgreementScore)) |>
select(Gender, AgreementScore) Using the recipies described in Section 3.2 in a slightly more compact way, we can detect if women and men differ in their perception of gender balanced representation in their research groups:
Show code for table
df.ocper001 |>
  tbl_continuous(variable=AgreementScore,
                 include=c("Gender"),
                 statistic = ~"{mean} ({sd})") |>
  add_p() |>
  modify_spanning_header(
all_stat_cols() ~ "**In general women and men are equally \rrepresented in my research unit**")| Characteristic |
In general women and men are equally represented in my research unit |
p-value2 |
|---|---|---|
| N = 771 | ||
| Are you | 0.003 | |
| A man | 4.22 (0.74) | |
| A woman | 3.54 (1.00) | |
| 1 AgreementScore: Mean (SD) | ||
| 2 Wilcoxon rank sum test | ||
As we can see in Table 9.1, men are more in agreement that their groups are gender balanced than women! The mean score for men is 4.22 being located between “[4] Agreement” and “[5] Strong agreement”. Most mean therefore think that women and men are equally represented in their research group or unit. In contrast, women respondents do not tend to agree to a similar degree as most of their response scores are between “[3] Neither agree or disagree” and “[4] Agree”, yielding a much lower mean score of 3.54. As the table furthermore shows, these differences are significant at p < 0.003 level, meaning these differences are extremely unlikely to have occured by chance.
Note foonote 2 in Table 9.1 indicating that the signifiance test has been carried out with the Wilcoxon test (Mann-Whitney U) for data that is not normally distribued.
The analysis therefore confirms our initial hypothesis, that the perception of gender (in)equalities within an organisation differs by gender itself.
9.2 Preferential treatment
Preferential allocation of resources and responsibilities is captured in question OCPER003 with its 12 sub-items shown in the following table.
| Code | Question & sub-question items |
|---|---|
OCPER003 |
Have you perceived a difference in the allocation of the following in your organisation? |
.SQ001. |
The receipt of mentoring and/or other guidance in making career decisions |
.SQ002. |
Representation in senior positions |
.SQ003. |
Positive attention from, or additional time with, senior management |
.SQ004. |
Access to informal circles of influence |
.SQ005. |
Recruitment and selection of new staff |
.SQ006. |
Promotion decisions |
.SQ007. |
Formal training and career development opportunities |
.SQ008. |
Invitations or opportunities (i.e., funding, additional time) to attend conferences, lectures, etc. |
.SQ009. |
Recognition of intellectual contributions during meetings, conferences, workshops, etc. |
.SQ010. |
Funds and monetary resources |
.SQ011. |
Awards and recognition of excellence |
.SQ012. |
Support in grant preparation and writing |
| Response options | |
| [1] Mainly allocated to women [2] Often allocated to women [3] I have not noticed a difference [4] Often allocated to men [5] Mainly allocated to men [6] I don’t have an opinion |
To start the analysis, a summary table of the rating scores for each item is helpful as shown in Table 9.2
Show code
df.geam02 |>
  tbl_likert(include = starts_with("OCPER003.SQ")) |>
add_n()| Characteristic | N | Mainly allocated to women | Often allocated to women | I have not noticed a difference | Often allocated to men | Mainly allocated to men | I don’t have an opinion |
|---|---|---|---|---|---|---|---|
| The receipt of mentoring and/or other guidance in making career decisions | 77 | 2 (2.6%) | 7 (9.1%) | 36 (47%) | 4 (5.2%) | 1 (1.3%) | 27 (35%) |
| Representation in senior positions | 77 | 5 (6.5%) | 5 (6.5%) | 45 (58%) | 13 (17%) | 4 (5.2%) | 5 (6.5%) |
| Responsibilities related to student care (e.g., providing support for students’ emotional wellbeing) | 77 | 7 (9.1%) | 9 (12%) | 41 (53%) | 0 (0%) | 0 (0%) | 20 (26%) |
| Positive attention from, or additional time with, senior management | 77 | 2 (2.6%) | 4 (5.2%) | 44 (57%) | 3 (3.9%) | 1 (1.3%) | 23 (30%) |
| Access to informal circles of influence | 77 | 0 (0%) | 1 (1.3%) | 38 (49%) | 8 (10%) | 5 (6.5%) | 25 (32%) |
| Recruitment and selection of new staff | 77 | 2 (2.6%) | 5 (6.5%) | 48 (62%) | 0 (0%) | 1 (1.3%) | 21 (27%) |
| Promotion decisions | 77 | 0 (0%) | 3 (3.9%) | 46 (60%) | 4 (5.2%) | 4 (5.2%) | 20 (26%) |
| Formal training and career development opportunities | 77 | 0 (0%) | 1 (1.3%) | 52 (68%) | 2 (2.6%) | 2 (2.6%) | 20 (26%) |
| Teaching responsibilities | 77 | 1 (1.3%) | 2 (2.6%) | 57 (74%) | 0 (0%) | 0 (0%) | 17 (22%) |
| Invitations or opportunities (i.e., funding, additional time) to attend conferences, lectures, etc. | 77 | 1 (1.3%) | 0 (0%) | 57 (74%) | 1 (1.3%) | 1 (1.3%) | 17 (22%) |
| Recognition of intellectual contributions during meetings, conferences, workshops, etc. | 77 | 0 (0%) | 1 (1.3%) | 50 (65%) | 4 (5.2%) | 4 (5.2%) | 18 (23%) |
| Funds and monetary resources | 77 | 0 (0%) | 0 (0%) | 50 (65%) | 4 (5.2%) | 2 (2.6%) | 21 (27%) |
| Awards and recognition of excellence | 77 | 0 (0%) | 0 (0%) | 54 (70%) | 5 (6.5%) | 1 (1.3%) | 17 (22%) |
| Supervision responsibilities (for undergraduate and graduate students) | 77 | 0 (0%) | 4 (5.2%) | 52 (68%) | 0 (0%) | 0 (0%) | 21 (27%) |
| Support in grant preparation and writing | 77 | 0 (0%) | 2 (2.6%) | 52 (68%) | 2 (2.6%) | 0 (0%) | 21 (27%) |
| Student acknowledgement (e.g., recognizing feedback and guidance, teaching and mentoring) | 77 | 0 (0%) | 3 (3.9%) | 51 (66%) | 0 (0%) | 0 (0%) | 23 (30%) |
A quick glance demonstrates that most respondents do not preceived a difference in the allocation or resources or recognition, as answer option “[3] I have not noticed a difference” is in all cases the most frequently selected option, followed by option “[6] I don’t have an opinion”.
Using Listing 9.2 we can convert OCPER003 items into a tidy format and calculate manually the proportion of respondents to visualise the overall pattern. Note, that we do this only for the first seven sub-question items, using the num_range() selector, in order to keep the resulting figure readable.
# calculate proportions
df.ocper003.prop <- df.geam02 |>
  select(num_range("OCPER003.SQ", range=1:5, width=3, suffix=".")) |>
  #select(starts_with("OCPER003.SQ")) |>
  drop_na() |>
  pivot_longer(cols=everything(), values_to = "Rating", names_to = "Item") |>
  group_by(Item, Rating) |>
  summarise(n = n(), .groups = "drop") |>
  group_by(Item) |>
mutate(Prop = n/sum(n))Constructing a stacked bar chart of the proportional responses produces Figure 9.2. The overall number of responses (N=77) have been scaled to the 100% given the 6 answer options for each question. This clearly shows the two dominant answer options “[3] I have not notice a difference” in yellow, and “[6] I don’t have an opinion”. Difference in the allocation of resources and responsibilities exist mainly with regards to student care which (mainly allocated to women) and access to senior positions (often allocated to men).
Show code for figure
cpal <- RColorBrewer::brewer.pal(6, "RdYlBu")

# do the chart
df.ocper003.prop |>
  ggplot(aes(x=Item,y=Prop, fill=Rating)) +
    geom_bar(stat="identity") +
    scale_fill_manual(values = cpal) +
    scale_y_continuous(labels = scales::percent_format()) +
    scale_x_discrete(labels = c("Mentoring", "Senior-Pos.", "StudentCare", "MngAtt", "InfCirc")) +
    labs(x = "Sub-question item", y = "Proportion") +
    coord_flip()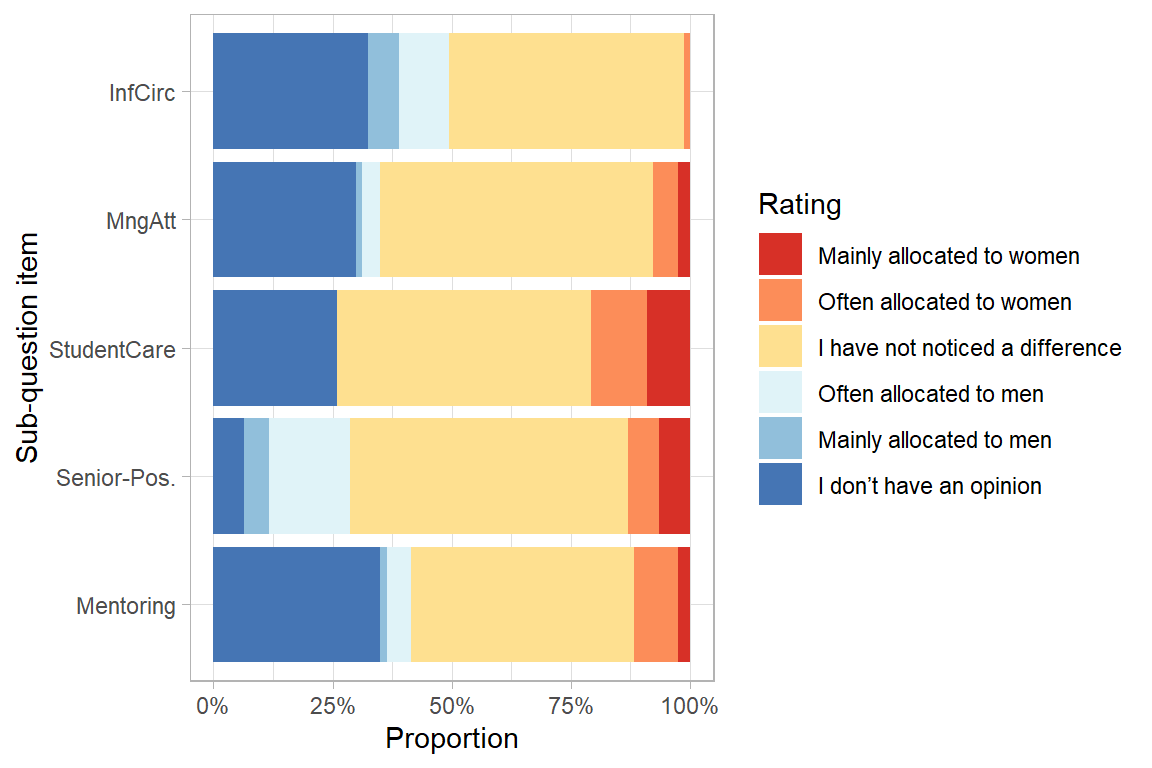
Please note the mismatch between the example data set and some of the default OCPER003 sub-question items, as the organisation has added and adapted these. For example the question on “Responsibilities related to student care (e.g., providing support for students’ emotional wellbeing)” is not part of the default GEAM for employees.
9.3 Masculinity Contest Culture
The aim of the Masculinity Contest Culture (MCC) scale is to assess how strongly an organization or organizational unit endorses masculine norms. Since the MCC is an organizational level variable, it correlates primarily with organizational level outcomes. A comparative analysis in the framework of the GEAM would be especially pertinent to explore differences between departments or faculties within one and the same organization (e.g. male dominated areas vs. female dominated areas). A possible proxy for this type of exploration could be disciplinary background of respondents (e.g. computer science or engineering versus arts & humanities.) As an organizational level measure, the MCC is a useful instrument to track the impact of organization level policies - when administered before and after the implementation of certain measures.
The concepts and measurement scale is introduced in the following two articles Berdahl et al. (2018) and Glick, Berdahl, and Alonso (2018):
Glick, Peter, Jennifer L. Berdahl, and Natalya M. Alonso. 2018. “Development and Validation of the Masculinity Contest Culture Scale.” Journal of Social Issues 74 (3): 449–76. https://doi.org/10.1111/josi.12280.
Berdahl, Jennifer L., Marianne Cooper, Peter Glick, Robert W. Livingston, and Joan C. Williams. 2018. “Work as a Masculinity Contest: Work as a Masculinity Contest.” Journal of Social Issues 74 (3): 422–48. https://doi.org/10.1111/josi.12289.
Overall, the MCC is made up of 4 factors that together constitute “masculine” norms at the organizational level:
- show no weakness
- demonstrate strength and stamina
- put work first
- engage in dog-eat-dog competition
Each dimension is captured with two sub-question as shown below. Although an organizational level measurement scale, outcomes at the organisational level are expected to trickle down to the individual level, for example in terms of turn-over intentions, burnout, job-satisfaction, or overall individual well-being of employees. As Glick and co-authors write, “[…] both men and women experienced masculinity contest workplaces as dysfunctional, rife with negative social behaviors, dissatisfying, and personallyl harmful.” (Glick, Berdahl, and Alonso 2018).
Masculinity contest norms correlate with having toxic leaders, a heterosexist culture, lower psychological team safety, and less support for work-life balance. It also correlates with bullying in general as well as sexual and ethnic harassment. Respondents from workplaces with higher masculinity contest norms reported “more personal experiences with coworkers bullying, sexual harassment and ethnic harassment”. The MCC is also moderately correlated with employees alientation from an organization.
The MCC is gathered in 8 variables, GlickMasculCont8.SQ0XX:
| Code | Item | Facet |
|---|---|---|
| GlickMasculCont8 | In my work environment: | |
| .SQ001. | Admitting you don’t know the answer looks weak | no weakness |
| .SQ002. | Expressing any emotion other than anger or pride is seen as weak | no weakness |
| .SQ006. | It’s important to be in good physical shape to be respected | stamina |
| .SQ007. | People who are physically smaller have to work harder to get respect | stamina |
| .SQ011. | To succeed you can’t let family interfere with work | put work first |
| .SQ012. | Taking days off is frowned upon | put work first |
| .SQ016. | You’re either “in” or you’re “out”, and once you’re out, you’re out | dog-eats-dog |
| .SQ017. | If you don’t stand up for yourself people will step on you | dog-eats-dog |
| Response options | ||
| [1] Not at all true for my work environment [2] Somewhat untrue for my work environment [3] Neither true nor untrue [4] Somewhat true for my work environment [5] Entirely true for my work environment |
Show code
cpal <- RColorBrewer::brewer.pal(4, "RdYlBu")

df.geam02 |>
  select(starts_with("GlickMasculCont8.SQ")) |>
  plot_likert(values="hide",
              show.prc.sign = T,
              grid.range = c(1,.8),
              expand.grid = T,
              show.n = T,
              wrap.legend.labels = 20,
              wrap.labels = 40,
              reverse.scale = T,
              catcount = 4,
              cat.neutral = 3,
              geom.colors = cpal) +
  theme(legend.position="bottom")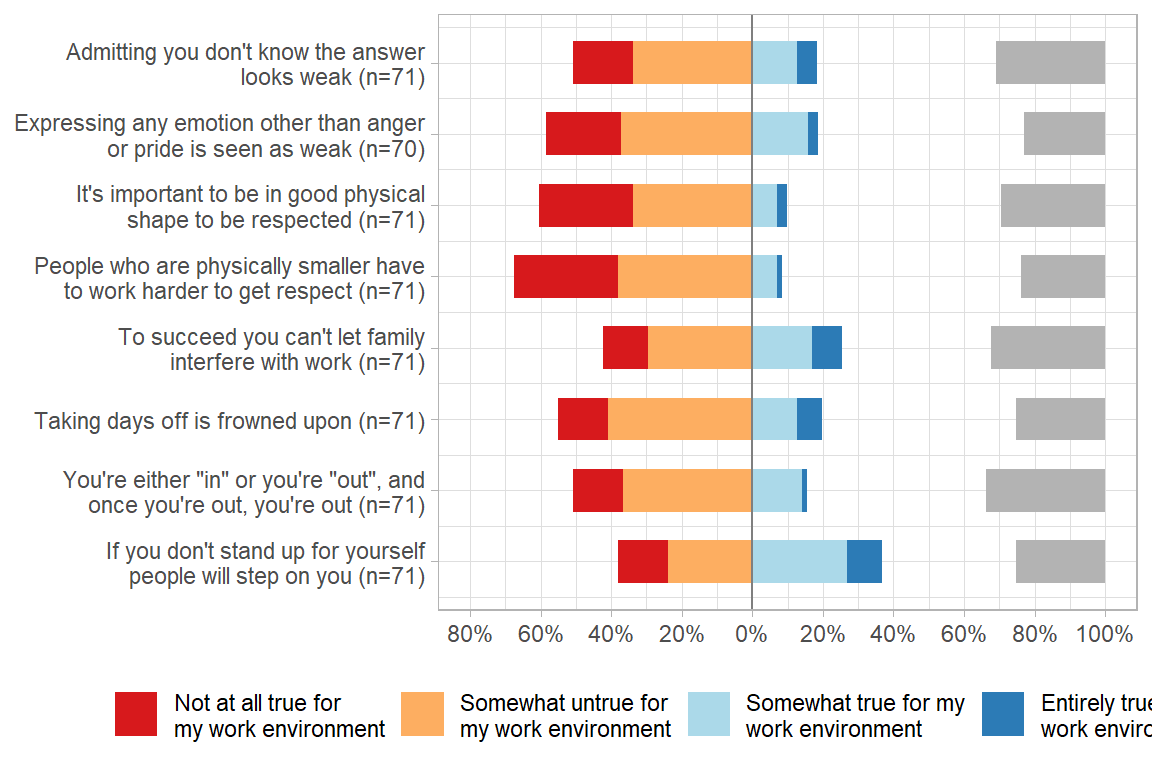
Based upon this first visual exploration, MCC scores can be used for downstream analysis. For example, Section 4.3.1 compares how MCC scores have changed between the first and second round of the GEAM survey withing the same organisation. As the analysis in Chapter 4 shows, there are only slight changes between the 2020 and 2024 data.
As described, MCC is an organisational level score best used to detect differences between organisational level units such as university faculties or departments. In lack of those, let’s see if MCC differ by type of staff (WCJC001).
Using similar code as in Listing 4.3, we first reverse all MCC scores and center them on 0. This eases interpretability, as negative scores indicate a strong masculinity contest culture, while positive scores indicate the opposite, namely the absence of a masculinity contest culture.
df.geam02 <- df.geam02 |>
  mutate(across(starts_with("Glick"), ~ fct_rev(.x), .names = "Rev_{.col}"),
         across(starts_with("Rev_Glick"), ~ {as.numeric(.x) - 3}),
mcc_mean = rowMeans(across(starts_with("Rev_Glick")), na.rm=T))df.geam02 |>
filter(!is.na(WCJC001)) |>
group_by(WCJC001) |>
summarize(
N = n(),
Mean = round(mean(mcc_mean, na.rm = TRUE),3),
StrdDev = round(sd(mcc_mean, na.rm = TRUE),3),
Median = median(mcc_mean, na.rm = TRUE),
IQR = IQR(mcc_mean, na.rm = TRUE)) | WCJC001 | N | Mean | StrdDev | Median | IQR |
|---|---|---|---|---|---|
| Academic / researcher | 49 | 0.558 | 0.693 | 0.750 | 0.875 |
| Technician | 5 | 0.425 | 1.198 | 0.125 | 1.500 |
| Administrative | 33 | 0.357 | 0.918 | 0.375 | 1.125 |
As Table 9.3 indicates, there are indeed differences between MCC scores between academics/researchers, Technicians, and Administrative staff. Since we have reversed the factors and centered the score on 0, a score of 2 on a given sub-question (e.g. “Admitting you don’t know the answer looks weak”) would indicate that it is “Not at all true for my work environment” while a score of -2 would indicate “Entirely true for my work environment”. As the above table suggests, academics/researchers in this particular organisation think overall more favorably of their work environment than technicians and administrative staff.
Show code
cpal <- RColorBrewer::brewer.pal(3, "Set1")

df.geam02 |>
  filter(!is.na(WCJC001) & !is.na(mcc_mean)) |>
  ggplot(aes(x=WCJC001, y = mcc_mean, fill=WCJC001)) +
    geom_boxplot(width=.8) +
    scale_fill_manual(values=cpal) +
    #scale_y_continuous(limits = c(-2, 2)) +
    labs(x="", y="Mean job satisfaction", fill="Year")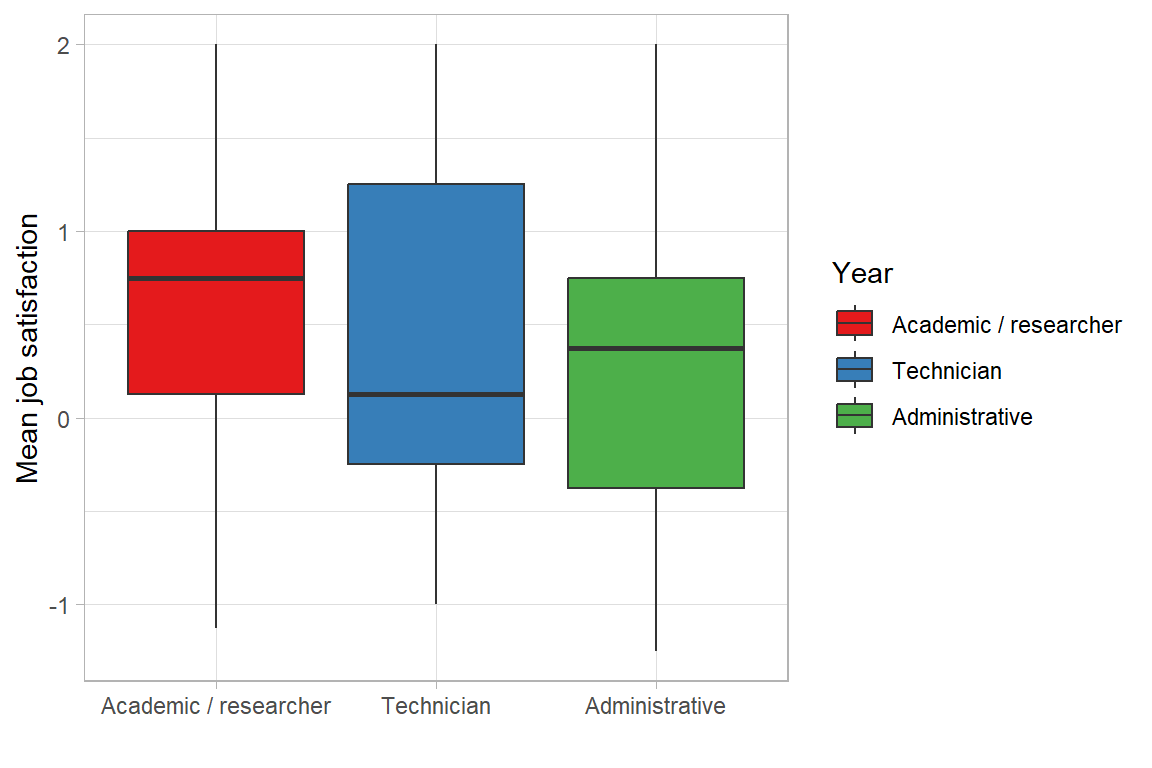
More in depth analysis could explore the following issues:
- differences in mean MCC scores between departments, faculties or other organisational units. This enables focused interventions in specific organisational units to improve working climate and culture
- correlations between MCC scores and experiences of bullying and harassment, by socio-demographic groups of employees.
- how MCC scores affect important outcome variables such as job satisfaction. This could be especially interesting from a cross-organisational comparison (see Chapter 5)
- monitor change over time (see Section 4.3.1) in mean MCC scores especially if targeted interventions have been put in place to improve overall working culture and climate
9.4 Gender bias against women leaders
GEAM version 3 includes a new measurement scale on how women leaders perceive and experience gender bias (Diehl et al. 2020). The scale allows to identify the specific types of bias prevalent for women leaders in a given organizations. Several factors of the Gender Bias Scale correlate with turnover intention and job satisfaction. The scale is descirbed in detail in the following article:
Diehl, Amy B., Amber L. Stephenson, Leanne M. Dzubinski, and David C. Wang. 2020. “Measuring the Invisible: Development and Multi-Industry Validation of the Gender Bias Scale for Women Leaders.” Human Resource Development Quarterly 31(3):249–80. doi: https://doi.org/10.1002/hrdq.21389.
The scale targets mainly women leaders and their experiences with or perceptions of organizational- and individual-level gender barriers in the workplace. In the context of higher education, this might refer to senior academic staff such as Principal Investigators but also middle management staff in Human Resources or similar.
The measurment scale is interesting as it identifies six higher order factors that cause gender biase against women (leaders). These include:
Barriers derived from male privilege — a source of influence that can dominate an organizational environment.
Women can experience disproportionate constraints due to constrained career choices, constrained communication, and being held to higher standards than men.
Insufficient support can refer to lack of mentoring, lack of sponsorhip, and exclusion from informal networks.
Devaluation captures those instances where women find their work contributions devalued, both psychologically and monetarily.
Fifth, women leaders may also face hostility, including through harassment, queen been syndrome.
And finally, acquiescence captures a woman’s apparent acceptance of her assigned place, by self-silencing on gender issues and self-limited aspirations.
The GEAM questionnaire has made a selection and adaption of some items of the original gender bias scale. which are split across two questions according to the answer options.
| Code | Sub-question items | Higher order factor - lower level factor |
|---|---|---|
DiehlBiasLeaderAgree |
Please indicate the extent to which you agree or disagree with the following statements: | |
.SQ001. |
I have been held responsible for organizational problems outside of my control | Male privilege - Glass cliff |
.SQ002. |
The decisions in my organisation are made by men | Male privilege - Male culture |
.SQ003. |
I have to work harder than my colleagues to be perceived as a legitimate professional | Not included in original scale |
.SQ004. |
I am held to the same standards as others for promotion or advancement | Not included in original scale |
.SQ005. |
Women in my organisation have to work harder than their men colleagues for the same credibility | Disproportionate constraints - Unequal standards |
.SQ006. |
High-level women in my organisation help other women succeed | Hostility - Queen bee syndrome (R) |
| Answer options | Notes | |
| [1] Strongly agree [2] Agree [3] Neither agree nor disagree [4] Disagree [5] Strongly disagree |
Items marked with (R) are reverse coded. |
Figure 9.5 provides an overivew of response patters of the gender bias scale for items using the agreement-disagreement likert scale.
Show code
cpal <- RColorBrewer::brewer.pal(4, "RdYlBu")

df.geam03 |>
  select(starts_with("DiehlBiasLeaderAgree.SQ")) |>
  plot_likert(values="hide",
              show.prc.sign = T,
              grid.range = c(1,.6),
              expand.grid = T,
              show.n = T,
              wrap.legend.labels = 15,
              wrap.labels = 30,
              reverse.scale = T,
              catcount = 4,
              cat.neutral = 3,
              geom.colors = cpal)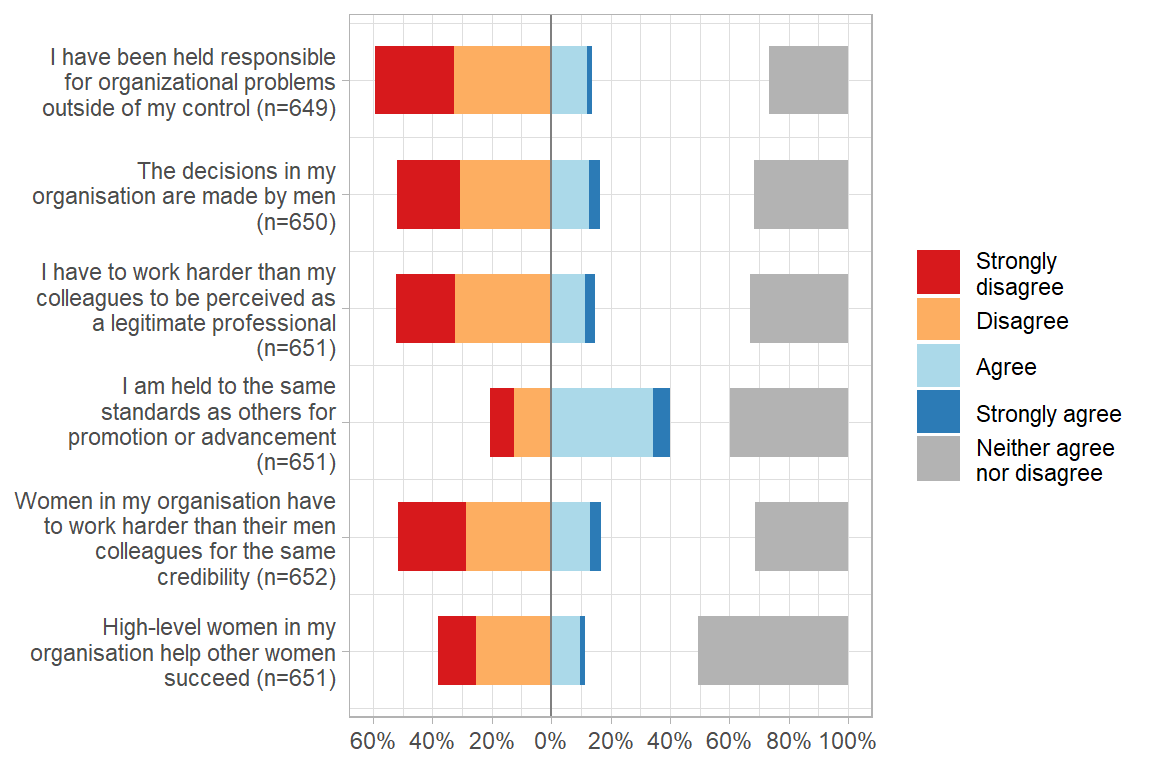
Overall, responses points to a rather gender fair working environment, as disagreement on disproportionate constraints and disproportionate constraints is rather high. Interesting, this holds less for the Hostility - Queen bee syndrom which is reverse coded. Here respondents also strongly disagree that high-level women help other women succeed in the organisation.
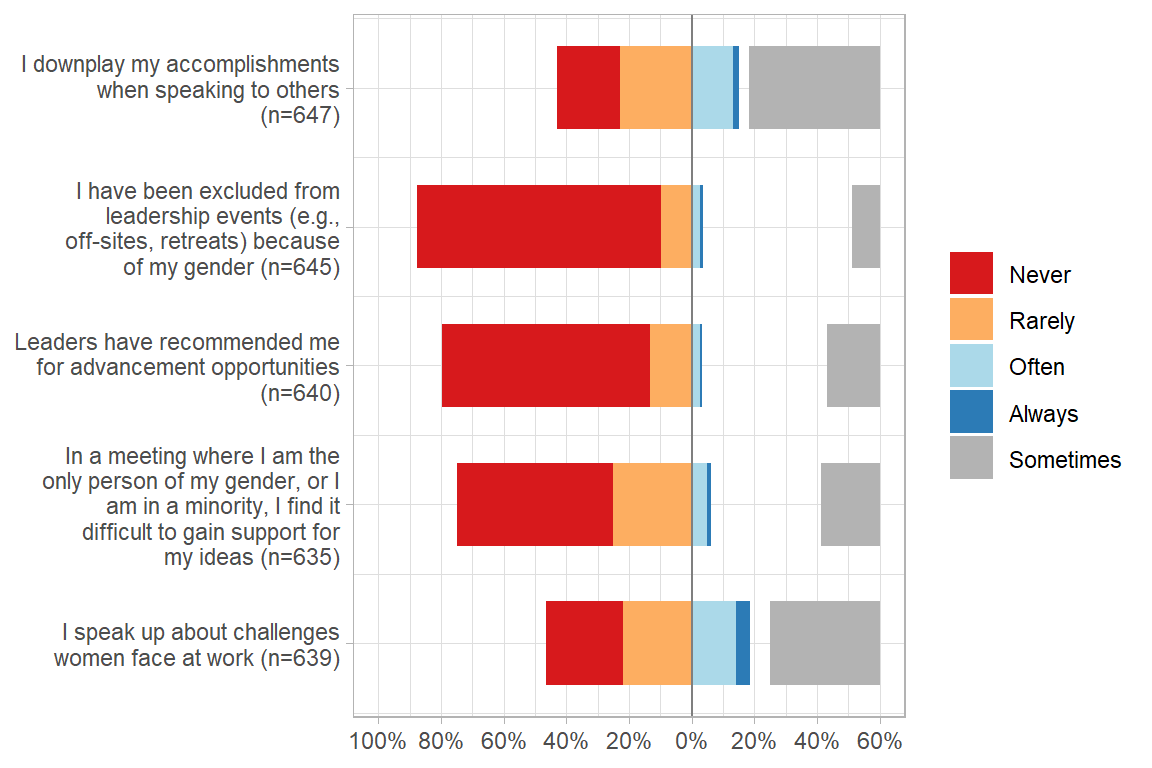
| Code | Question / sub-question items | Higher order factor - lower level factor |
|---|---|---|
DiehlBiasLederFreq |
Please indicate whether the following statements apply to you: | |
.SQ001. |
I downplay my accomplishments when speaking to others | Disproportionate constraints - Constrainted communication |
.SQ002. |
I have been excluded from leadership events (e.g., off-sites, retreats) because of my gender | Insufficient support - exclusion |
.SQ003. |
Leaders have recommended me for advancement opportunities | Insufficient support - Lack of sponsorship (R) |
.SQ004. |
In a meeting where I am the only person of my gender, or I am in a minority, I find it difficult to gain support for my ideas | Devaluation - Lack of acknowledgement |
.SQ005. |
I speak up about challenges women face at work | Acquiescence - Self-silencing (R) |
| Answer options | Notes | |
| [1] Never [2] Rarely [3] Sometimes [4] Often [5] Always |
Items marked with (R) are reverse coded |
A quick visual inspection in Figure 9.6 shows the overall response pattern for the frequency based response items in the scale.
Show code
cpal <- RColorBrewer::brewer.pal(4, "RdYlBu")

df.geam03 |>
  select(starts_with("DiehlBiasLeaderFreq.SQ")) |>
  plot_likert(values="hide",
              show.prc.sign = T,
              grid.range = c(.6,1),
              expand.grid = T,
              show.n = T,
              wrap.labels = 30,
              reverse.scale = T,
              catcount = 4,
              cat.neutral = 3,
              geom.colors = cpal)