8 Analysing work-life balance

The following chapter provides an overview of the main variables and questions regarding work-life balance issues. This includes questions on parental leave options and policies, dedicated measurement scales on work-family conflict, as well as questions regarding employees care responsibilities for children or dependent adults. Using statistical techniques introduced in Part I of this book, selected analysis are carried out. The GEAM questionnaire includes many questions regarding work-life balance and thus enables a solid diagnostic of work-life balance issues and their related (gender) inequalities in organisations.
Career progression, Work-life balance, Vertical segregation, Gender gaps
The GEAM covers many variables concerned with the working conditions of respondents, including type of contract, complementary bonus, recruitment and training options, work-life balance, parental leave, among others.
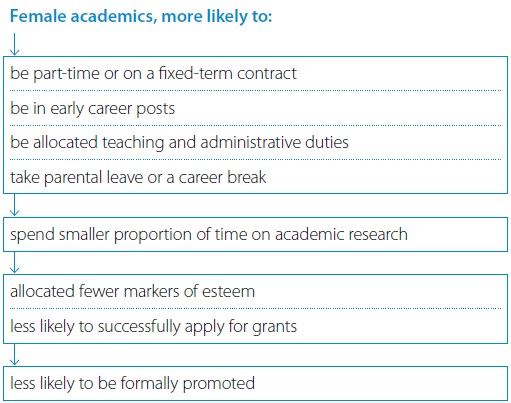
Among the central dimensions of gender inequality in research performing organisations are work-life balance issues and fair career progression. Vertical segregration remains one of the most persistent gender inequalities in R&I: the higher on the career ladder, the less women. According to the most recent She Figures 2024 publication (European Commission 2025), women represent approximately half (48 %) of Doctoral (ISCED 8) graduates at EU level but only 29.7% of highest Grade A positions.
The overall result of fewer women at the top is the result of a many different factors contributing to an overall slower career progression of women.
For example, the analysis of the ASSET 2016 survey uncovered how differences between men and women regarding type of contracts, parental leave and others can have a cumulative effect on women’s careers and representation.
The GEAM holds several variables that contribute to an analysis of career progression and the potential disadvantages faced by women compared to their male colleauges. These variables are bundled under different question groups on working conditions, including:
- Recruitment and promotion
- Encouragement to apply for promotion (
WCJC013) - How did you obtain your current job (
WCJC014)
- Encouragement to apply for promotion (
- Type of contract
- part-time vs full-time (
WCJC010) with women usually being over-represented among part-time employees - permanent vs temporary contract (
WCJC011) with (early career) women usually being over-represented among employees with temporary contracts (see also Section 3.1.2)
- part-time vs full-time (
- Training opportunities, which are important for career progression
- Training opportunities available and received (
WCJC019) - Barriers to training (
WCJC021)
- Training opportunities available and received (
- Care responsibilties are a crucial topic with regards to work-life balance issues and career advancement. Several question cover these:
- Care responsibilities for dependent adults (
WCWI006) and children (WCWI008) - If care responsibilities for children exist,
WCWI009indicates the number of children, andWCWI010status of single parent.
- Care responsibilities for dependent adults (
- Parental leave covers policies targeting work-life balance issues. These include:
- Uptake over the past 5 years (
WCWI011a) and type of parental leave (WCWI011b) taken; reasons for not taking leave (WCWI026) - Time since last uptake of leave (
WCWI027) - Policies available before, during and upon return from leave (
WCWI016); helpfullness of these policies (WCWI021) and overall preparedness to return from leave (WCWI020)
- Uptake over the past 5 years (
- Work-family conflict scale (
WorkFamConfISSP) and several question on job statisfaction (EWCS89JobSatisfact8andEWCS88JobSatisfact1) as well as work intensity (EWCS36WorkIntensity2). For an example analysis of job satisfaction see Section 3.2.2. - Flexible work arrangements
- GEAM v2 included question
WCWI005with several sub-items on flexible work arrangements (for an example analysis see Section 3.2.1). This section has been revised due to Covid and contains now dedicated question on flexible work options (WCFlexibility), frequency of teleworking (WCTeleworkfreq), reasons for not teleworking (WCTeleworkNO) and for teleworking (WCTeleworkYES) and possible improvements to working arranagements (WCValuedAspects).
- GEAM v2 included question
In what follows we introduce some of these questions in more detail, especially where questions require certain pre-processing steps or use existing measurement scales drawn from the scientific literature.
8.1 Care responsibilities
Women tend to have considerably more care responsibilities than men, both for children but also for dependent adults (Gimenez-Nadal and Molina 2020). The GEAM covers both of these aspects using question WCWI006 (dependent adults) and WCWI008 (children).
| Code | Question | Responses |
|---|---|---|
WCWI006 |
Are you the primary carer or assistant for an adult requiring care? | [1] No [2] Yes [3] Prefer not to say |
WCWI008 |
Are you the parent or legal guardian of any children aged 17 years or younger? | [1] No [2] Yes [3] Prefer not to say |
Gender gaps in care responsibilities can be explored quickly using code-recipies introduced in Chapter 2 and Chapter 3.
For example, by using Listing 3.1, we can generate stacked barcharts to visualise the relative proportion of women and men with care responsibilities. Note that this uses a binary gender variable, applying Listing 2.3 before printing the plot.
Click to show code for following figure
df.geam03 |>
  crosstab_plot(WCWI006, SDEM004.bin, fillab="Dependent adult")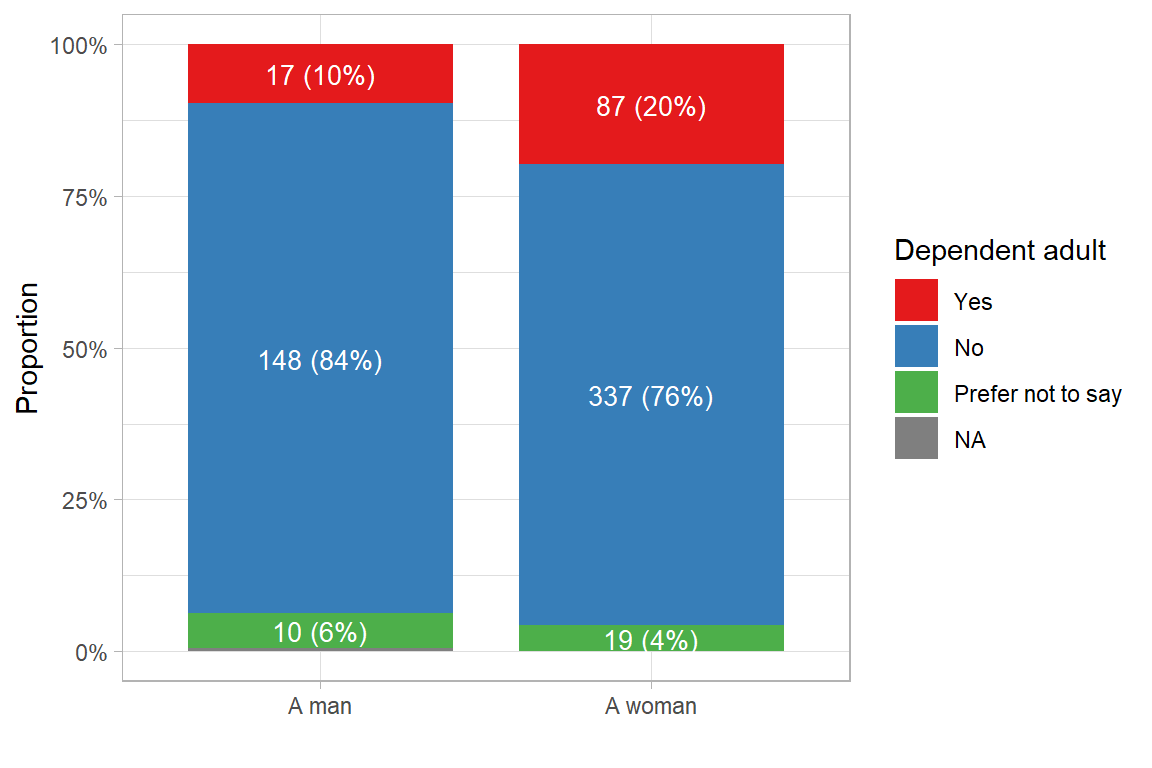
Click to show code for following figure
df.geam03 |>
  crosstab_plot(WCWI008, SDEM004.bin, fillab="Children")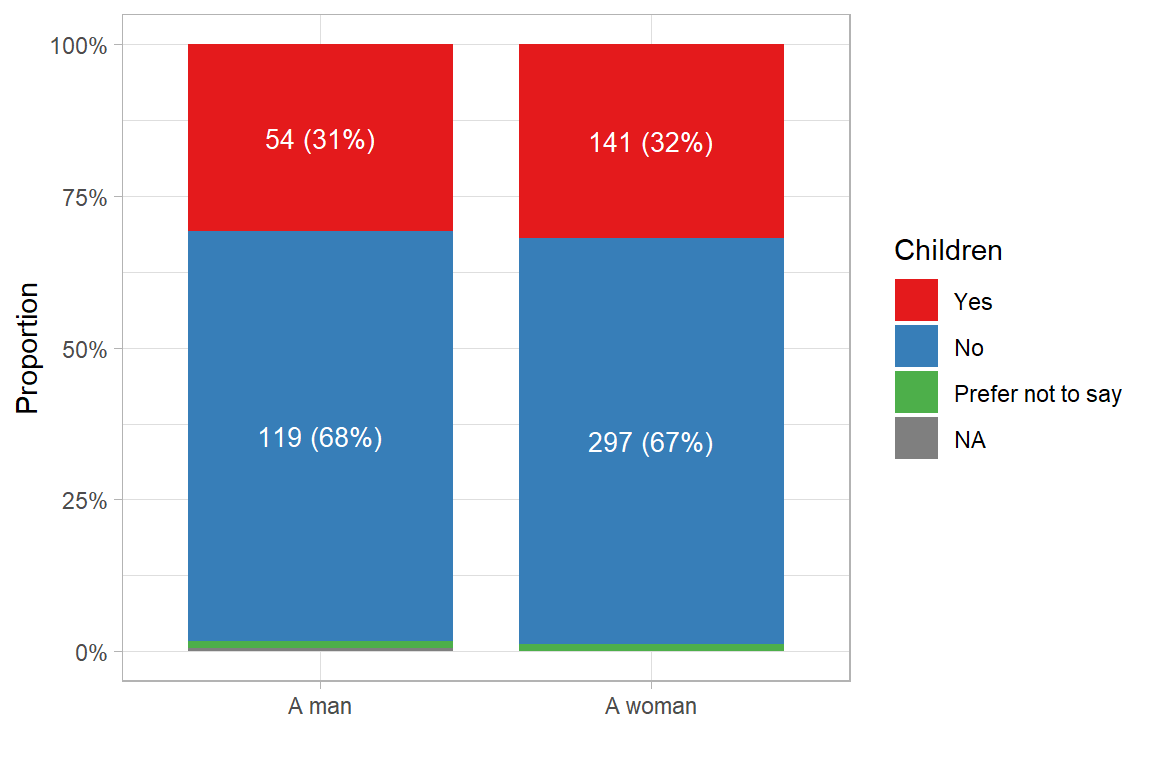
In both Figure 8.2 and Figure 8.3 we can see that women have more care responsibilities than their male colleagues.
For many subsequent analysis (e.g. in relation to the work-family conflict scale), we combine these two care-related variables in Listing 8.1 into a single variable called CareResp. It is set to TRUE if a respondent is a primary carer for an adult or has caring responsibilities for children, and set to FALSE otherwise.
  df.geam03 <- df.geam03 |>
        mutate(CareResp = if_else((WCWI006 == "Yes" |
WCWI008 == "Yes"), TRUE,FALSE))At this point we do not differentiate which type of care responsibilities respondents have. Using the newly created CareResp variable we check if there exist statistically significant gender differences for care responsibilities in our dataset (see Section 3.1).
df.sub.01 <- df.geam03 |>
  filter(!is.na(SDEM004.bin) & !is.na(CareResp)) |>
  transmute(
    Gender = fct_drop(SDEM004.bin),
    CareResp = CareResp
)Show code for contingency table
# custom function to calculate different test statistics: chi-square, cramer, fisher
statsnote <- crosstab_stats(df.sub.01, "Gender", "CareResp")

# create the contingency table
df.sub.01 |>
  tbl_cross(
    row = Gender,
    col = CareResp,
    percent = c("row"),
  ) |>
  bold_labels() |>
  modify_footnote_header(
    footnote = statsnote[[1]],
    columns = last_col(),
    replace=F
  )
CareResp
|
Total1 | ||
|---|---|---|---|
| FALSE | TRUE | ||
| Are you | |||
| A man | 111 (63%) | 64 (37%) | 175 (100%) |
| A woman | 236 (53%) | 207 (47%) | 443 (100%) |
| Total | 347 (56%) | 271 (44%) | 618 (100%) |
| 1 Chi-squared = 4.85 | p-value = 0.0276 | df = 1 | Cramér’s V = 0.092 | Fisher’s p = 0.0245 | |||
As Table 8.1 shows, gender differences in care responsibilities tend to be significant at the p < 0.05 signifance level. As Figure 8.2 shows, the difference concerns mainly care responsibilities for dependent adults, where men have fewer care responsibilities than women.
8.2 Parental leave
The frequency with which academic staff takes parental leave can differ by gender. Women often take more parental leave which can negatively affect their academic productivity and hence career progression.
The GEAM includes a series of questions regarding parental leave. To start with, WCWI011a and WCWI011b gather baseline data who has taken parental leave and which type:
| Code | Question | Responses |
|---|---|---|
WCWI011a |
Considering the last 5 years, have you taken or are you currently taking any form or parental leave? | [1] No [2] Yes [3] Prefer not to say |
WCWI011b |
Which of the following forms of leave have you taken / or are you currently taking? | [1] Maternity leave [2] Paternity leave [3] Adoption leave [4] Unpaid parental leave [4] Paid parental leave |
In addition, questions WCWI016, WCWI020, WCWI021 gather further details regarding parental leave policies, return to work support measures and if they are preceived as useful.
Click to show code for illustration
df.geam03 |>
  crosstab_plot(WCWI011a, SDEM004.bin, fillab="Parental leave")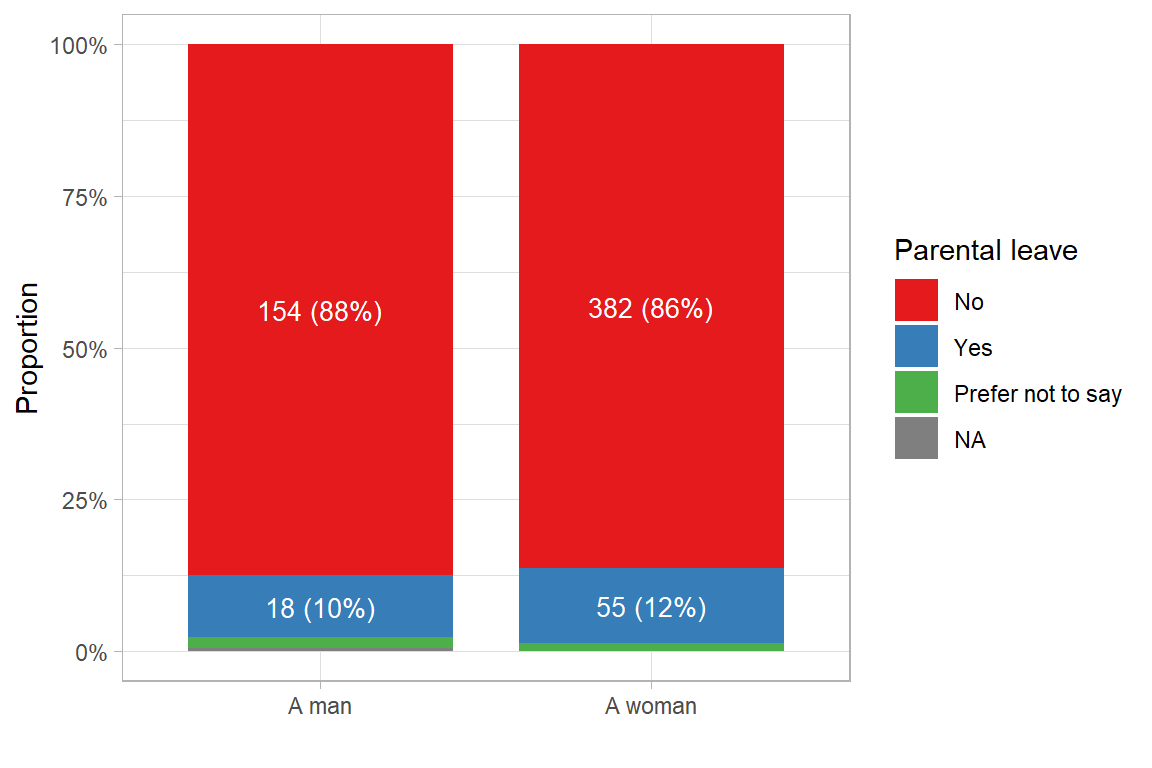
The chart presents the distribution of parental leave uptake by gender, categorised into three response options: ‘Yes’, ‘No’, and ‘Prefer not to say’. Among men, 88% reported not having taken parental leave, 10% reported having taken it, and 2% preferred not to answer. Among women, 86% responded ‘No’, 12% responded ‘Yes’, and 1% selected ‘Prefer not to say’. The distribution indicates a slightly higher reported uptake of parental leave among women compared to men. While the overall proportions are similar, the small increase in reported uptake among women may reflect differences in access, eligibility, or social norms surrounding parental responsibilities.
In a subsequent step, further statistical analysis shows whether the observed differences are statistically significant. For that we also remove the ‘Prefer not to say’ answer option from parental leave (WCWI011a) which contains too few respondents. We also remove all respondents without an answer.
Click to see code to generate contingency table
# drop unused factor levels
df.sub.03 <- df.geam03 |>
  mutate(ParentLeave = if_else(WCWI011a == "Prefer not to say", NA_character_, WCWI011a)) |>
  filter(!is.na(ParentLeave) & !is.na(SDEM004.bin)) |>
  transmute(
    ParentLeave = fct_drop(ParentLeave),
    Gender = fct_drop(SDEM004.bin)
  )

# custom function to calculate different test statistics
statsnote <- crosstab_stats(df.sub.03, "Gender", "ParentLeave")

# create the contingency table
df.sub.03 |>
  tbl_cross(
    row = Gender,
    col = ParentLeave,
    percent = c("row"),
  ) |>
  bold_labels() |>
  modify_footnote_header(
    footnote = statsnote[[1]],
    columns = last_col(),
    replace=F
  )
ParentLeave
|
Total1 | ||
|---|---|---|---|
| No | Yes | ||
| Are you | |||
| A man | 154 (90%) | 18 (10%) | 172 (100%) |
| A woman | 382 (87%) | 55 (13%) | 437 (100%) |
| Total | 536 (88%) | 73 (12%) | 609 (100%) |
| 1 Chi-squared = 0.344 | p-value = 0.557 | df = 1 | Cramér’s V = 0.029 | Fisher’s p = 0.579 | |||
Table 8.2 indicates that there are no statistically significant gender differences regarding parental leave (χ² = 0.344, p = 0.557 and Fisher’s p = 0.579). Furthermore, the Cramér’s V value (0.029) suggests no association, reinforcing the conclusion that the relationship between gender and parental leave uptake in this particular organisation is minimal.
Overall, these findings suggest that, within this sample, gender does not appear to influence parental leave uptake in a statistically meaningful way.
8.3 Work-Family Conflict Scale
Existing research indicates the negative impact of work-family conflict in terms of heightened burnout (Kinman and Jones 2008), lower job satisfaction, diminished health and higher turnover intentions (Zábrodská et al. 2018) for academic staff.
The GEAM uses the Work-Family Conflict Scale (Breyer and Bluemke 2016) which is a well established measurement instrument on work-life balance that has been used in the 2002 and 2012 version of the Family and Changing Gender Roles module of the International Social Survey Program (ISSP).
Source: Breyer, B., and M. Bluemke. 2016. “Work-Family Conflict Scale (ISSP).” ZIS - The Collection Items and Scales for the Social Sciences. https://doi.org/10.6102/zis243.
The variable (WorkFamConfISSP) is composed of four items which are subdivided in two dimensions to measure how work interferences with family (WF) and how family interferes with work (FW).
| Code | Item | Facet |
|---|---|---|
WorkFamConfISSP |
How often has each of the following happened to you during the past three months? | |
.SQ001. |
I have come home from work too tired to do the chores which need to be done. | WF - work interferes with family |
.SQ002. |
It has been difficult for me to fulfil my family responsibilities because of the amount of time I spent on my job. | WF - work interferes with family |
.SQ003. |
I have arrived at work too tired to function well because of the household work I had done. | FW - family interferes with work |
.SQ004. |
I have found it difficult to concentrate at work because of my family responsibilities. | FW - family interferes with work |
| Answer options | ||
| [1] Several times a week [2] Several times a month [3] Once or twice [4] Never |
Note that for earlier version of the GEAM, the identification of sub-questions slightly changes from underscore “_” to dot “.” For example, to reference sub-question item one, the correct code for older version is WorkFamConfISSP_SQ001 while for newer version it is WorkFamConfISSP.SQ001.
In addition, there are national reference values available to deduce if respondents are below or above the national average of work conflict (see also here).
8.3.1 Preparation and pre-processing
In order to use the work-family conflict scale for a more in-depth analysis, several pre-processing steps need to be carried out.
Reverse coding
First, the scale needs to be recoded in order to ease interpretation. Original response items are coded starting with the lowest value representing the most sever work-life conflict “[1] = Several times a week” to the highest value representing the least work-life conflict “[4]=Never”. The following code reverses the factor levels so that lower numers indicate lower work-family conflict and higher numbers will indicate a higher work-family conflict. In addition, we substract 1 from each score, so that “[0]=Never” coincides with a numeric 0. The fct_rev() method from the forcats package does this job. We can conveniently convert all four sub-questions items with the across() function, which selects all variable names that start with WorkFamConfISSP and saves them into corresponding new variables Rev_WorkFamConfISSP using the .names argument. In addition, we need to convert the factor variables to numeric variables to calculate mean values for the scales in a subsequent step (and substract 1).
# reverse factor levels
df.geam03 <- df.geam03 |>
  mutate(across(starts_with("WorkFamConfISSP"), ~ fct_rev(.x), .names = "Rev_{.col}"),
across(starts_with("Rev_WorkFamConfISSP"), ~ {as.numeric(.x) - 1}))The order is now reversed where lower numbers indicate lower conflict and higher ratings a stronger work-family conflict.
Mean values
Since the work-family conflict scale is composed of two different dimension, we can calculate the average values for both, the work-family conflict as well as the family-work interference for each respondent. This will make it easier to produce summary statistics for the entire survey in a second step and explore potential gender gaps.
# calculate row means for work-family conflict scale
df.geam03 <- df.geam03 |>
  mutate(WorkFamMean = rowMeans(across(c("Rev_WorkFamConfISSP.SQ001.","Rev_WorkFamConfISSP.SQ001.")), na.rm=T),
         FamWorkMean = rowMeans(across(c("Rev_WorkFamConfISSP.SQ003.","Rev_WorkFamConfISSP.SQ004.")), na.rm=T),
WFCMean = (WorkFamMean+FamWorkMean)/2) 8.3.2 Exploring patterns
Since the Work-family conflict scale includes four sub-question items that respondents rate on 4 answer options, we use a Likert plot to get an overview of the overall distribution.
Show code for figure
cpal <- RColorBrewer::brewer.pal(4, "RdYlBu")

df.geam03 |>
  select(starts_with("WorkFamConfISSP")) |>
  sjPlot::plot_likert(values="sum.outside",
              show.prc.sign = T,
              grid.range = c(1.1, 1.1),
              expand.grid = T,
              wrap.legend.labels = 10,
              geom.colors = cpal)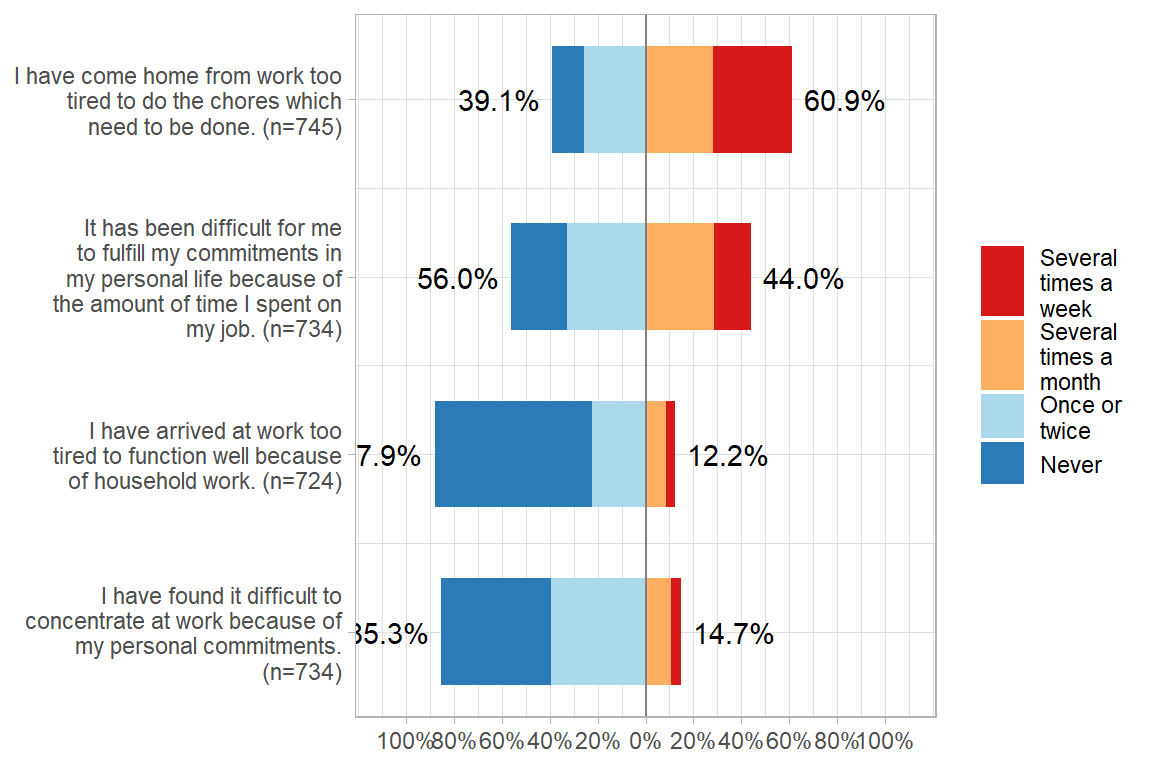
As Figure 8.5 demonstrates, more respondents have difficulties to concile their work with family responsibilities than respondents where family interferes with work. For example, 60.9% of respondents indicate that they’ve “come home from work too tired to the chores” either “several times a week” or “several times a month”. By comparison, 87.9% of respondents indicate that their household responsibilities do “Never” or “Once or twice” interfere with work.
We also see that the pattern is consistent, i.e. the upper two bars and the lower two bars exhibit similar percentages for each answer option. We would expect this consistency due to conceptualization of work-family conflict as a two-directional phenomena, where the upper two items measure the same family-work interference while the lower two items measure work-family intereference.
Show code for producing precise scores
df.geam03 |>
  tbl_likert(include = starts_with("WorkFamConfISSP")) |>
add_n()| Characteristic | N | Several times a week | Several times a month | Once or twice | Never |
|---|---|---|---|---|---|
| I have come home from work too tired to do the chores which need to be done. | 745 | 243 (33%) | 211 (28%) | 191 (26%) | 100 (13%) |
| It has been difficult for me to fulfill my commitments in my personal life because of the amount of time I spent on my job. | 734 | 114 (16%) | 209 (28%) | 239 (33%) | 172 (23%) |
| I have arrived at work too tired to function well because of household work. | 724 | 26 (3.6%) | 62 (8.6%) | 161 (22%) | 475 (66%) |
| I have found it difficult to concentrate at work because of my personal commitments. | 734 | 30 (4.1%) | 78 (11%) | 289 (39%) | 337 (46%) |
Examining the mean values of work-family as well as family-work conflict confirms the visual result:
Show code for producing summary table
df.geam03 |>
   summarise(Total = n(),
              'Mean Work-Family' = mean(WorkFamMean, na.rm=T),
              'Mean Family-Work' = mean(FamWorkMean, na.rm=T),
              'Overall Mean' = mean(WFCMean, na.rm=T)) |>
mutate(across(where(is.numeric), \(x) round(x, 2)))| Total | Mean Work-Family | Mean Family-Work | Overall Mean |
|---|---|---|---|
| 907 | 1.8 | 0.62 | 1.21 |
The mean value for work-family conflict is considerablly higher (mean=1.8) compared to the mean value for family-work conflict (0.62).
Builing upon these insights, a more in-depth exploration could follow, for example exploring work-family conflict scores in relation to different socio-demographic groups, including gender, age, marital status, or socio-economic background (SDEM017 and SDEM018). Other interesting variables to examine in this regard include of course care responsibilities for dependent adults (WCWI006) and children (WCWI008), or type of contract WCJC010 (full- or part-time). In addition, the effect of parental leave could be analysed, comparing ISSP scores between employees with children that have taken parental leave or those who have not.